

How AI Transforms Study Notes into Infographics
AI tools now make it easy to turn study notes into clear, visual infographics in minutes. Here's how it works:
- Text Analysis: AI scans your notes to find key ideas and connections.
- Visual Matching: It selects the best charts, diagrams, or layouts to present the data effectively.
- Design Automation: The tool polishes the infographic with colors, fonts, and layouts for a professional look.
Why It Matters:
- Visuals are processed 60,000 times faster than text.
- Students using infographics perform 50% better in studies.
- AI tools can save students 2+ hours weekly by automating the process.
Popular Tools:
| Tool | Features | Best For | Cost |
|---|---|---|---|
| Canva AI | Smart design, templates | Beginners | Free plan available |
| Piktochart AI | Text-to-infographic, education-focused | Academic projects | Special pricing |
| Visme AI | Advanced design, collaboration tools | Team projects | Premium features |
| Adobe Express | Pro-grade tools, Creative Cloud integration | Multimedia content | Subscription |
| Infogram | Smart charts, interactive visuals | Data-heavy content | Enterprise pricing |
Tips for Better Infographics:
- Organize notes with headings and key terms.
- Review AI-generated visuals for accuracy and clarity.
- Use a mix of visuals and text for balanced learning.
AI-powered infographics save time and improve retention, making them a great tool for students and teachers alike.
How to Generate Stunning Infographic in ONE Click (Text to Infographic)
3 Steps: How AI Creates Infographics from Notes
AI takes your notes and turns them into infographics through three main steps, blending text analysis with smart visual design.
1. Breaking Down the Text
The AI scans your notes to pull out important ideas, keywords, and how they connect. For example, if you're studying biology, it might highlight terms like chlorophyll and glucose production [1].
2. Picking the Right Visuals
Next, the AI matches your content with visuals that make sense for the data. Using a vast library of icons, charts, and layouts, it selects the best way to present the information [3]. Here's how it pairs content with visuals:
- Numbers and Stats → Charts (e.g., comparing test scores)
- Processes or Steps → Flowcharts (e.g., cell division stages)
- Hierarchies → Tree Diagrams (e.g., biological classifications)
- Comparisons → Side-by-side layouts (e.g., contrasting historical periods)
- Timelines → Linear progressions (e.g., scientific breakthroughs)
3. Fine-Tuning the Design
Finally, the system polishes the infographic to make it visually appealing and easy to understand [3].
It offers options like:
- Color themes to match your content
- Easy-to-read fonts
- Organized layouts for clarity
- Interactive elements for deeper engagement
Since 65% of people learn better through visuals [3], this process helps students turn complex notes into clear, brain-friendly visuals.
Top AI Tools for Making Educational Infographics
AI tools have made creating educational infographics easier than ever. By automating design and offering user-friendly features, these tools help students and educators turn ideas into visually engaging content.
AI Tool Feature Comparison
Here’s a quick breakdown of some popular AI-powered infographic tools:
| Tool | Features | Best For | Cost |
|---|---|---|---|
| Canva AI | - Smart design suggestions - Auto layout generation - Huge template library |
Beginners, general infographics | Free plan available |
| Piktochart AI | - Text-to-infographic conversion - Customizable templates - Education-focused |
Academic projects, data visuals | Special education pricing |
| Visme AI | - Advanced design automation - Templates for education - Collaboration tools |
Team projects, complex designs | Premium features |
| Adobe Express | - Professional-grade tools - Creative Cloud integration - Rich media options |
Multimedia content, advanced needs | Creative Cloud subscription |
| Infogram | - Smart chart recommendations - Data analysis tools - Interactive elements |
Statistics, data-heavy content | Enterprise-level pricing |
When picking a tool, think about how much customization you need and whether the platform meets your design and content goals.
QuizCat AI: Study Material Conversion Tools
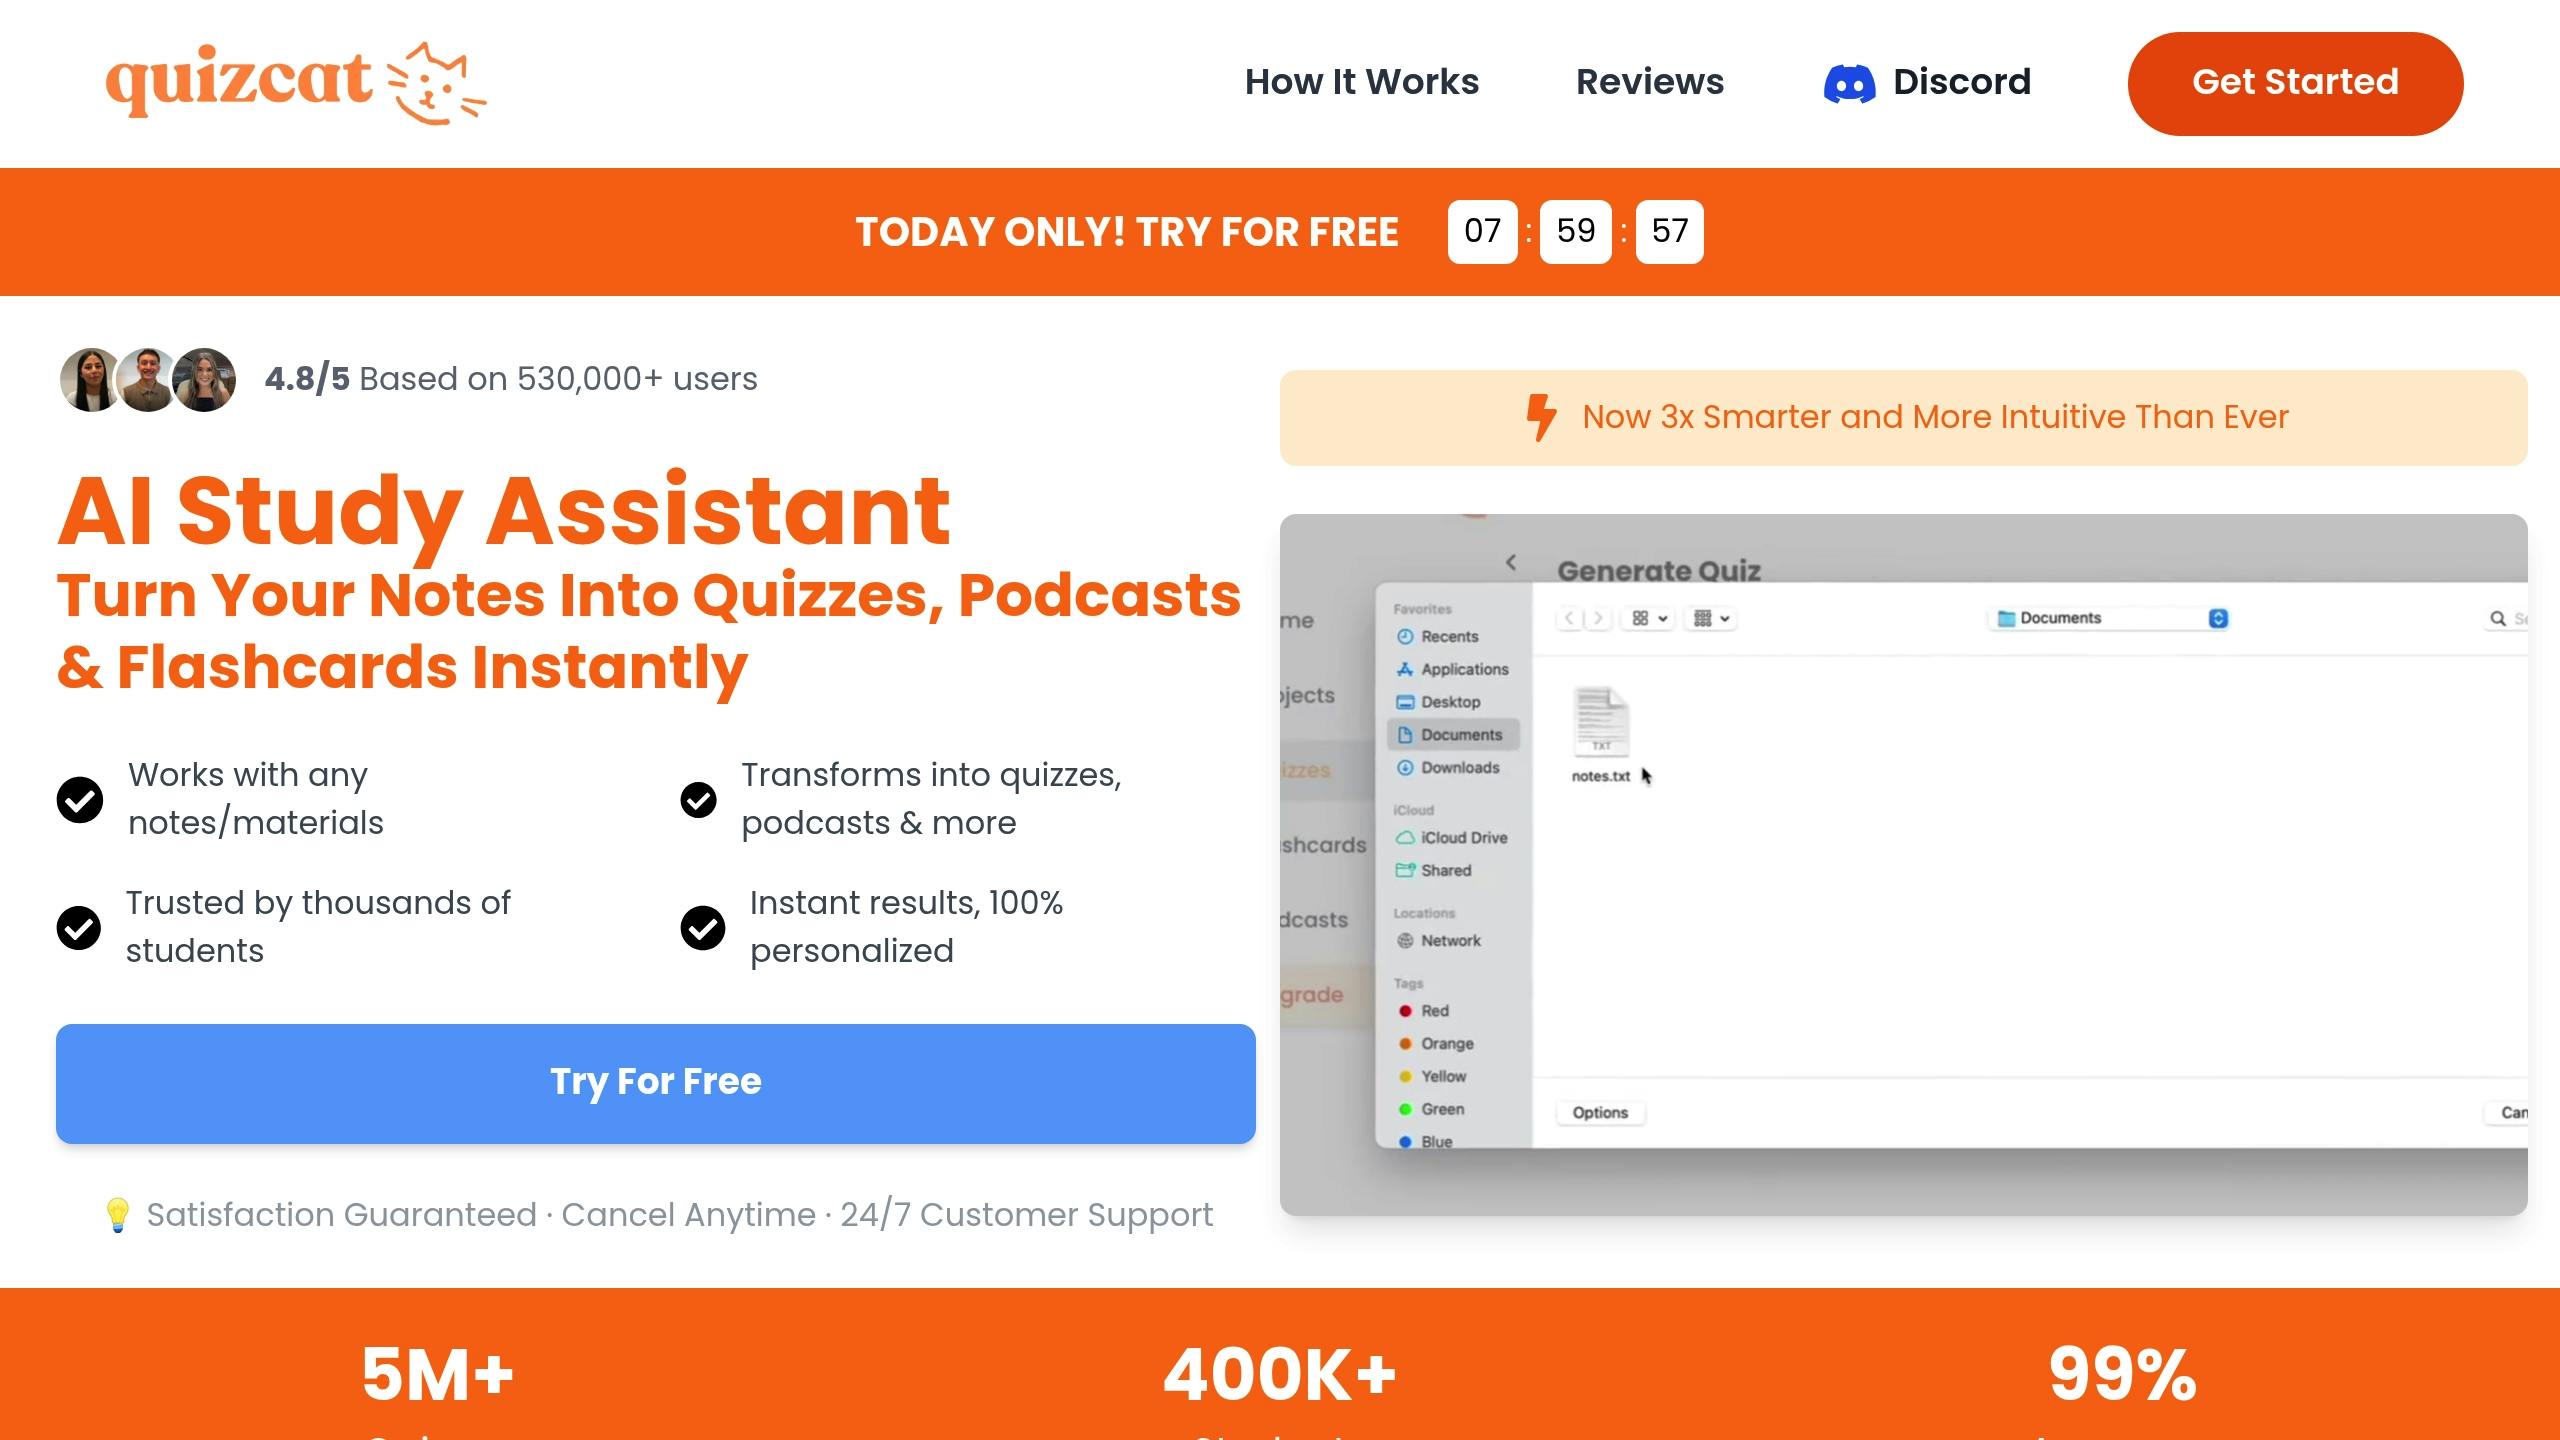
While most AI tools focus on visuals, QuizCat AI takes a different approach, catering to students who want to transform their study materials into multiple formats. Here's what it offers:
- Infographics and More: Converts notes into infographics, quizzes, and flashcards for better learning variety.
- Tailored Learning: Adapts to your individual study habits and preferences.
- Mobile-Friendly: Ensures study materials are easy to access on any device.
Students using QuizCat AI have reported a 40% improvement in retention thanks to its visual and interactive approach [5].
sbb-itb-1e479da
Using AI Infographics in Education
Student Examples: Exam Prep Methods
Students are turning to AI-generated infographics to simplify complex topics, such as:
- Enzyme pathways in biochemistry
- Literary character networks
- Statistical trends
Sarah Chen, a biology major at Stanford University, shared her experience with QuizCat AI:
"Converting my dense biochemistry notes into visual flowcharts helped me understand enzyme cascades better."
Research backs this up, showing that students retain 65% of information when it's paired with relevant visuals [1].
Teacher Examples: Classroom Materials
Teachers are also seeing success by integrating AI infographics into their lesson plans. The Journal of Educational Psychology reports that students spend 42% more time engaging with AI-generated visuals compared to traditional text materials [2].
Ms. Rodriguez, a chemistry teacher at Westfield High, said:
"Customized infographics showing element relationships and real-world applications significantly improved retention during unit tests."
Here’s how educators are using AI infographics effectively:
| Purpose | Method | Impact |
|---|---|---|
| Introducing Topics | Visual concept maps for new units | 28% increase in student participation [4] |
| Explaining Complex Ideas | Interactive process diagrams | 22% improvement in test scores [4] |
| Homework Assignments | Student-created visual summaries | Boosted critical thinking skills |
Teachers are also using AI infographics to tailor lessons for different learning speeds. For example, Oakridge High School employs tiered infographics to meet students at their own pace.
Mr. Thompson, a history teacher, explained:
"AI-generated timeline infographics helped students grasp World War II chronology more effectively than textbook readings."
Tips for Creating Better AI Infographics
To get the most out of AI when creating infographics, you need to focus on preparing clear input materials and carefully reviewing the output.
Formatting Guidelines to Follow
- Use a clear structure: Organize your notes with headings and subheadings to help AI understand the hierarchy of information.
- Keep it simple: Write sentences that focus on one idea at a time.
- Highlight key terms: Use bold text to emphasize important concepts.
- Add data: Include relevant statistics to make your infographics more informative.
How to Check the Quality of AI-Generated Infographics
Once the AI generates your infographic, it's crucial to validate the output. Here are some key areas to review:
| Check Type | What to Do |
|---|---|
| Content Accuracy | Double-check the infographic against your original notes and verify all data points. |
| Visual Hierarchy | Make sure the most important concepts are easy to spot and well-organized. |
| Design Coherence | Ensure the colors, fonts, and overall design are consistent and easy to read. |
Reviewing Your Infographics
When you're reviewing the final infographic, focus on these areas:
- Content Validation: Confirm that all elements in the infographic align with your source material. Check that relationships between concepts are clear and data is represented correctly.
- Visual Optimization: Use a color scheme that matches the topic and add spacing to avoid a cluttered look.
- Accessibility:
- Test the color contrast to make sure it's readable for everyone.
- Verify that the design is easy to view on mobile devices.
- Add descriptive alt-text for any visual elements to ensure inclusivity.
Conclusion: AI Tools for Better Study Materials
AI-powered infographics are changing the way we create and use study materials by blending smart automation with visual learning. These tools streamline the design process, cutting down the time needed from hours to just minutes. This gives students more time to focus on understanding concepts, rather than getting bogged down in creating resources. Their impact goes beyond just one study session, reshaping how we process and remember information in education.
To get the most out of AI infographic tools, try these strategies:
- Update infographics weekly to reinforce learning.
- Use a mix of visuals and text for a balanced learning approach.
- Incorporate peer reviews to ensure quality and accuracy.
| Study Approach | How to Use It | Benefits |
|---|---|---|
| Regular Updates | Revise weekly with updated infographics | Better retention and understanding |
| Mixed Methods | Combine AI visuals with handwritten notes | A richer, more complete learning experience |
AI's role in education continues to expand, offering features like personalized learning, real-time content updates, and stronger visual integration. However, for the best outcomes, pair AI's efficiency with a human touch to review and fine-tune the final materials.
FAQs
Can ChatGPT generate infographics?
No, ChatGPT cannot directly create infographics or visual content since it is a text-focused AI model. For visual outputs, you’ll need tools specifically designed for creating infographics.
| What ChatGPT Does | What Infographic Tools Do |
|---|---|
| Generates text content | Creates visual designs |
| Suggests layouts | Offers drag-and-drop interfaces |
| Organizes information | Provides pre-made templates |
| Interprets data | Converts data into visuals |
To make the most of your efforts, pair ChatGPT with tools like Canva AI. These tools bring features such as:
- Visual Creation: Turn written content into polished infographics.
- Customizable Designs: Easily tweak layouts, colors, and text.
- Data Visualization: Simplify complex data into charts or graphs.
- Pre-Made Templates: Save time with ready-to-use design options.
When using ChatGPT to prepare for an infographic, focus on:
- Writing clear, concise text.
- Structuring information logically.
- Highlighting key data points.
"ChatGPT lacks image generation capabilities" [1]
For a smooth workflow, let ChatGPT handle content creation while tools like Canva AI take care of the design. This approach combines strengths, ensuring professional and eye-catching results.